![]()

Estimates and predicts the wet season calendar (WSC) and soil water balance for agricultural applications. It integrates daily potential evapotranspiration (PET) and soil water balance parameters to compute the WSC for crop and soil water management. Using these parameters, AquaBEHER can estimate and predict the onset, cessation, and duration of the wet season based on an agroclimatic approach.
⛓ Key Features
- Daily potential evapotranspiration (PET) estimation using various methods.
- Daily soil water balance estimation based on adjustable soil water holding capacity (soilWHC).
-
Wet season calendar estimation and seasonal prediction including:
- Onset of the wet season
- Cessation of the wet season
- Duration of the wet season
AquaBEHER is designed to facilitate water-efficient agricultural practices in response to climate variability and change.
⬇️ Installation
Install from CRAN:
install.packages("AquaBEHER")⏩ Quick Example
Here’s a quick example to estimate daily soil water balance:
library(AquaBEHER)
data(AgroClimateData)
# Estimate PET using Penman-Monteith method
PET <- calcEto(AgroClimateData, method = "PM", Zh = 10)
# Add PET to the dataset
AgroClimateData$Eto <- PET$ET.Daily
# Estimate daily soil water balance for a soil with 100mm water holding capacity
watBal.list <- calcWatBal(data = AgroClimateData, soilWHC = 100)
watBal <- watBal.list$data
head(watBal)
#> GridID Lat Lon Elev WHC Year Month Day Rain Tmax
#> 1 MOZ0007149 -15.09238 39.2519 392.1337 97.84914 1982 1 1 0 32.24396
#> 2 MOZ0007149 -15.09238 39.2519 392.1337 97.84914 1982 1 2 0 33.07202
#> 3 MOZ0007149 -15.09238 39.2519 392.1337 97.84914 1982 1 3 0 33.49679
#> 4 MOZ0007149 -15.09238 39.2519 392.1337 97.84914 1982 1 4 0 32.76818
#> 5 MOZ0007149 -15.09238 39.2519 392.1337 97.84914 1982 1 5 0 32.65872
#> 6 MOZ0007149 -15.09238 39.2519 392.1337 97.84914 1982 1 6 0 31.80630
#> Tmin Rs Tdew Uz Eto R AVAIL TRAN DRAIN RUNOFF
#> 1 23.11500 23.86698 20.21160 4.723783 6.447727 0 0 0 0 0
#> 2 23.12585 26.38375 20.48284 4.279407 6.802067 0 0 0 0 0
#> 3 23.12602 25.00704 20.45689 3.622179 6.485418 0 0 0 0 0
#> 4 23.60351 24.16475 20.83896 2.535047 5.838723 0 0 0 0 0
#> 5 22.79294 23.44483 21.36882 1.477617 5.231518 0 0 0 0 0
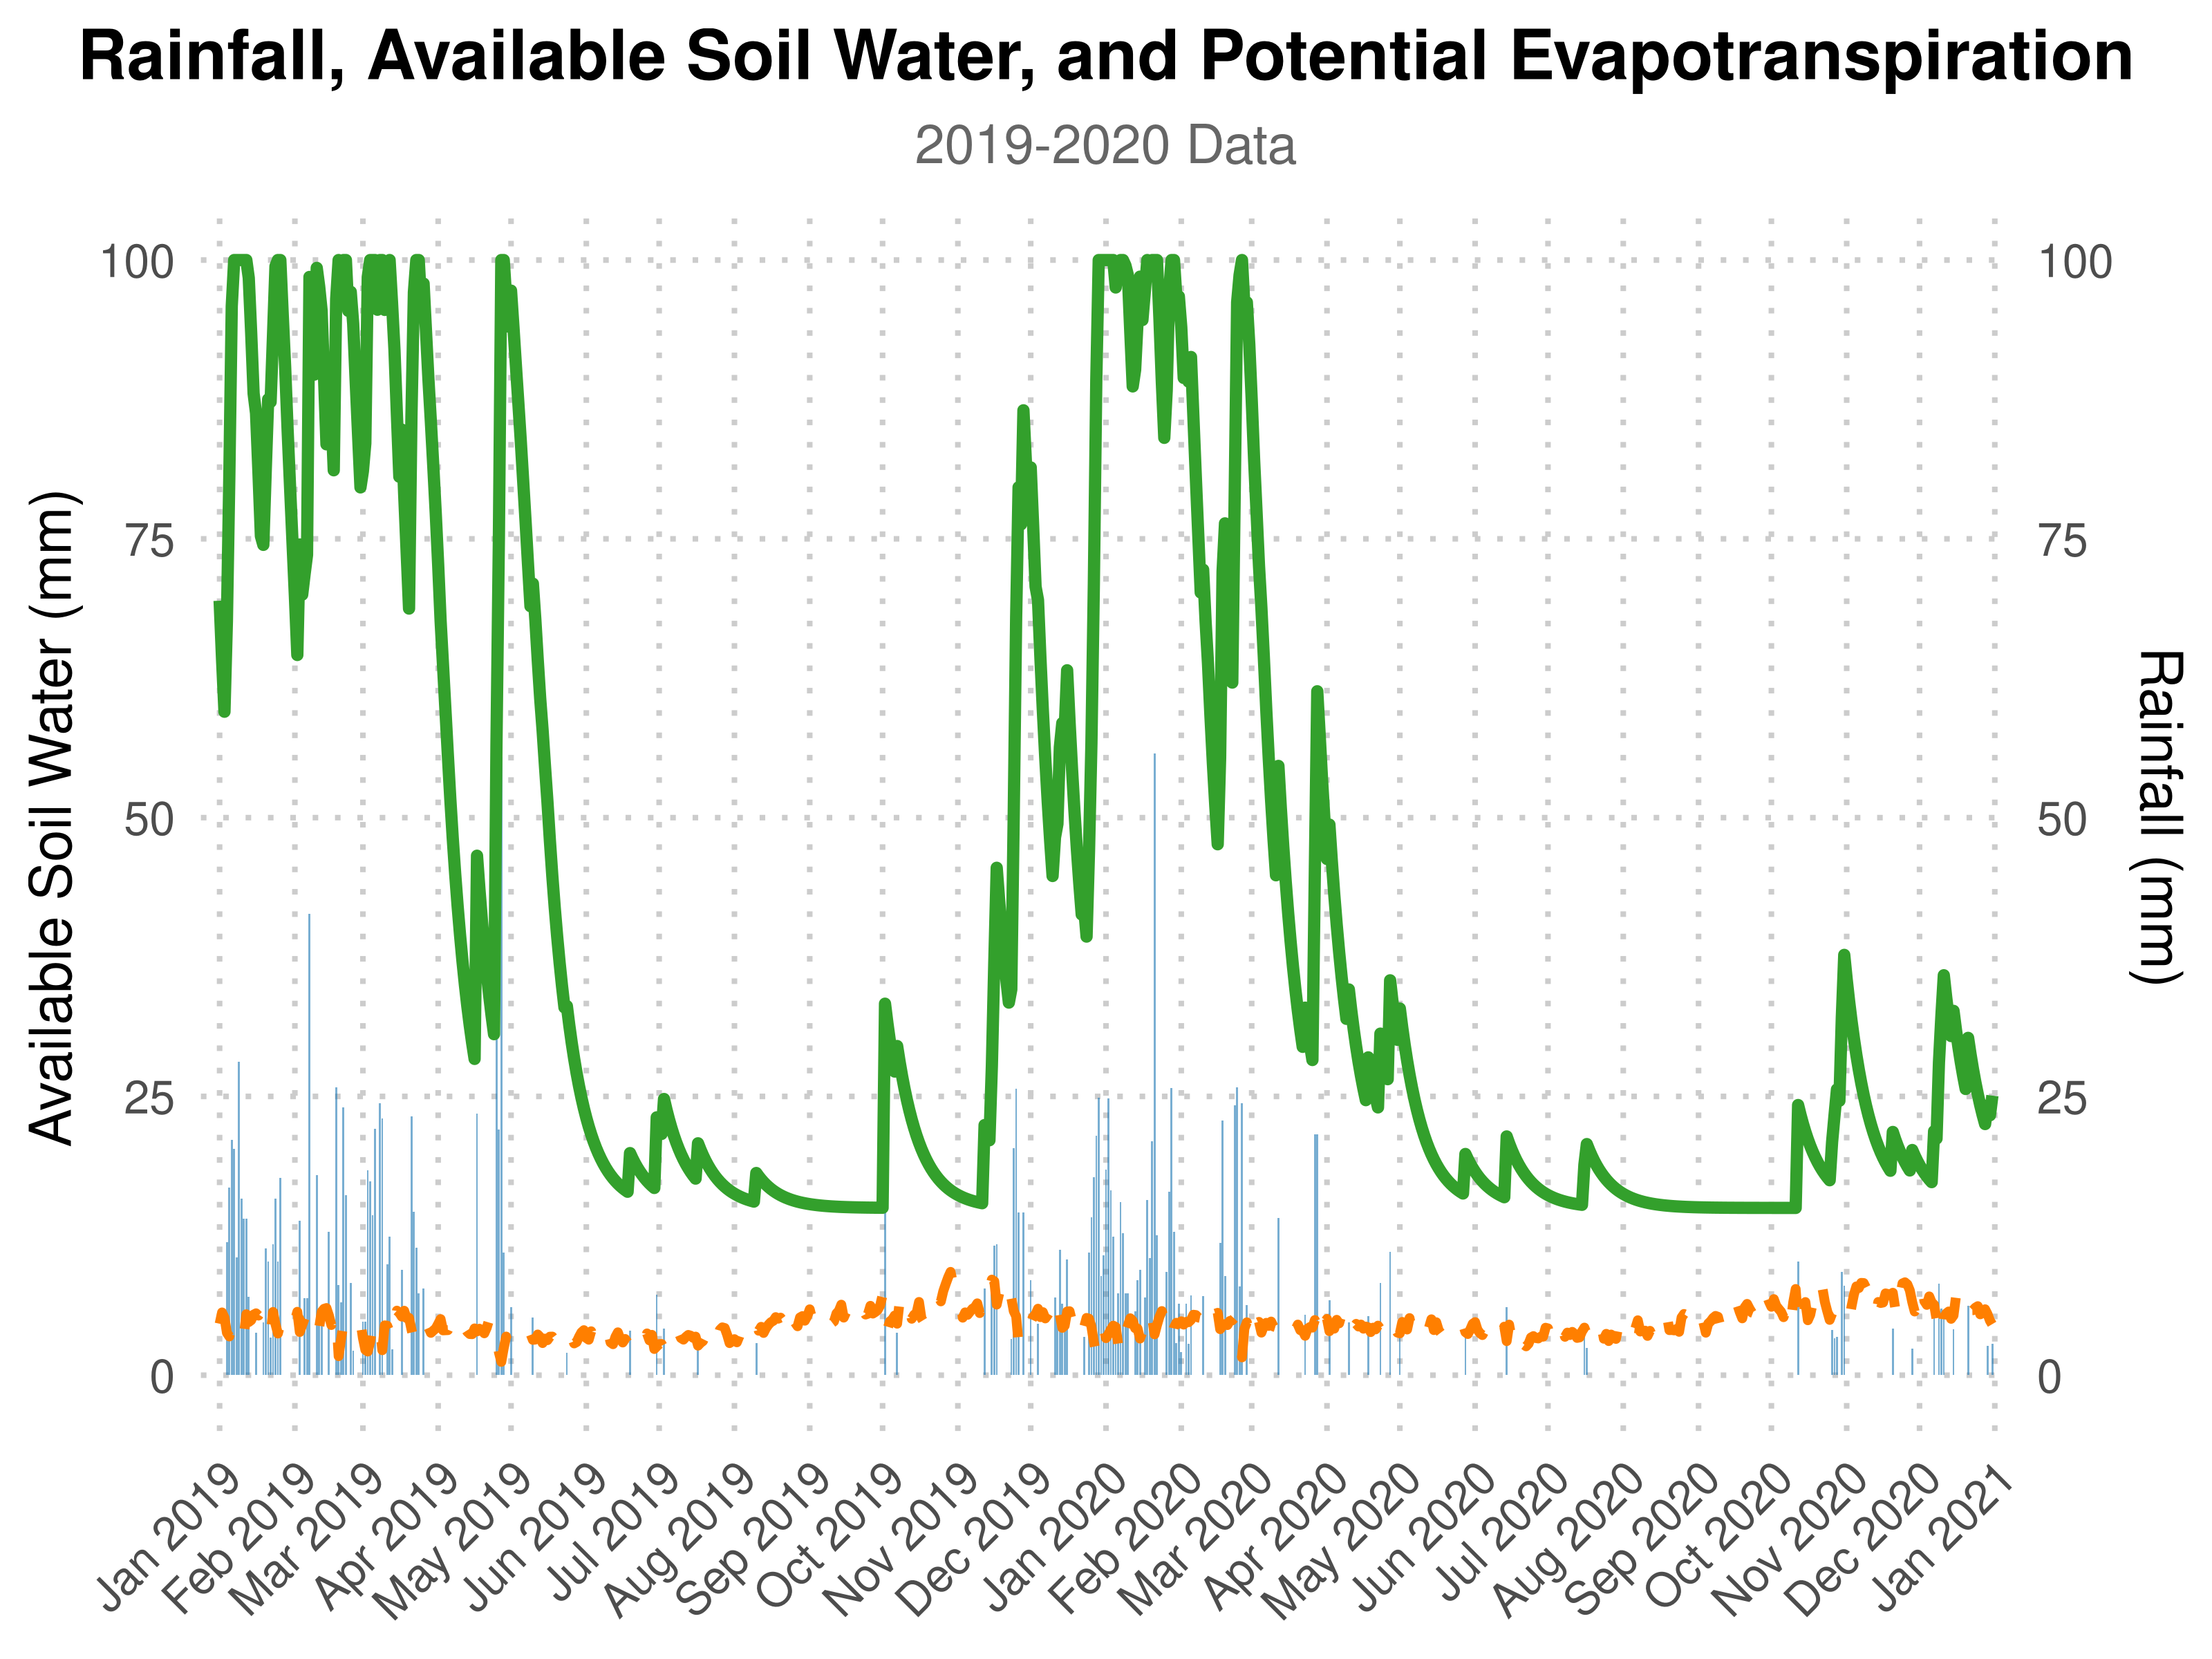
#> 6 22.43975 21.99277 21.29297 1.953415 5.026133 0 0 0 0 0📊 Visualization
Visualize the daily soil water balance, rainfall, and potential evapotranspiration (Eto) for the climatological year 2019–2020:
library(ggplot2)

# Filter the data for 2019 and 2020
watBal.19T20 <- watBal[watBal$Year %in% c(2019, 2020), ]
date.vec <- as.Date(paste(watBal.19T20$Year, watBal.19T20$Month, watBal.19T20$Day, sep = "-"), format = "%Y-%m-%d")
watBal.19T20$date <- date.vec

# Plot water balance with ggplot2
ggplot(watBal.19T20, aes(x = date)) +
  geom_bar(aes(y = Rain), stat = "identity", fill = "#1f78b4", alpha = 0.6, width = 0.8) +
  geom_line(aes(y = AVAIL), color = "#33a02c", size = 1.5) +
  geom_line(aes(y = Eto), color = "#ff7f00", size = 1.2, linetype = "dashed") +
  scale_x_date(date_labels = "%b %Y", date_breaks = "1 month", expand = c(0.01, 0)) +
  scale_y_continuous(
    name = "Available Soil Water (mm)",
    sec.axis = sec_axis(~., name = "Rainfall (mm)")
  ) +
  labs(
    title = "Rainfall, Available Soil Water, and Potential Evapotranspiration",
    subtitle = "2019-2020 Data",
    x = NULL, y = NULL
  ) +
  theme_minimal(base_size = 15) +
  theme(
    plot.title = element_text(face = "bold", size = 18, hjust = 0.5),
    plot.subtitle = element_text(size = 14, hjust = 0.5, color = "grey40"),
    axis.text.x = element_text(angle = 45, hjust = 1),
    panel.grid.minor = element_blank(),
    panel.grid.major = element_line(linetype = "dotted", color = "grey80")
  )
📝 Citation
If you used AquaBEHER in your work, please cite it. You can view the most recent citation by running:
citation(package = "AquaBEHER")To cite `AquaBEHER` in publications, please use:
Robel Takele, Matteo Dell'Acqua (2023). `AquaBEHER`: Estimation and Prediction of Wet Season Calendar and Soil
Water Balance for Agriculture. R package version 1.0.0. Available at
https://cran.r-project.org/web/packages/AquaBEHER
A BibTeX entry for LaTeX users is:
@Manual{,
title = {`AquaBEHER`: Estimation and Prediction of Wet Season Calendar and Soil Water Balance for Agriculture},
author = {Robel Takele and Matteo Dell'Acqua},
year = {2023},
note = {R package version 1.0.0},
url = {https://robeltakele.github.io/AquaBEHER/},
}🌍 Feedback and Contributions 🤝
We appreciate feedback and contributions to improve AquaBEHER. Feel free to report bugs, suggest features, or join discussions.
Your contributions make a difference!
✤ We appreciate your support and look forward to making our package even better with your help!
📬 Contact Us

The Genetics Group at the Institute of Plant Sciences is a culturally diverse, research-driven team focused on advancing agricultural innovation. We combine crop genetics, climate science, and participatory strategies to develop sustainable farming solutions.
We are based at Scuola Superiore Sant’Anna, Pisa, Italy.
For inquiries, please reach out to: - Matteo Dell’Acqua - Mario Enrico Pè
Learn more about our work on the institute web page.
🌟 Show Your Support
If you find AquaBEHER helpful or interesting, please consider giving us a star on GitHub. Your support helps promote the project and lets others know it’s worth checking out.
🙏 Thank you for your support! 👍

👥 Contributors
👨💻 Robel Takele
Email: takelerobel@gmail.com
GitHub: @RobelTakele
👨💻 Matteo Dell’Acqua
Email: m.dellacqua@santannapisa.it
GitHub: @MatteoDellAcqua